Like everyone else at Scott Logic, I was looking high and low to find a good option for using my IDB budget. Having spent last year’s allocation on a course (and a slightly dubious one at that) I was firm that I would not buy another lengthy course this year. As I have been working on a data engineering project for the past couple of years and it requires me sift through a lot of articles on Google and Google being smart, it prompted me a link to this Data+AI summit. After I had a quick look at the agenda, I was intrigued. It is arranged by Databricks who are the platform that offers an enterprise version of Apache Spark. Apache Spark is open source and all the main cloud providers have one or more product that offers Apache Spark to run distributed process. But Databricks is still, shall we say, the pathfinder when it comes to adding new features and taking Spark in a market facing, time appropriate direction. Most of the features they develop eventually get released into the open source version.
The last two years I have used Spark quite extensively and that has given me a taste of its power as well as the challenges. So I was keen for an opportunity to roll my sleeves and open the bonnet on that engine. The Performance Tuning on Apache Spark one day training course offered at the Data+AI summit looked like just the thing. It said all the right things on the label. And how did it go?
From the get go, it forced us to put our analytical hat on. There were some well prepared course material that consisted of pre-run Databricks Notebooks and Spark UI to explore the outcome of the run. They also make those available for later for anyone who wants to run them in their own time. But some of those jobs are deliberately quite resource heavy and time consuming to demonstrate problems with the setup. So it made sense have pre-run notebooks that were ready for digging into problems. We had to identify problems in the scripts by looking at the logs and graphs in the Spark UI. It is useful to mention here everything in Spark is executed in a lazy manner. There are transformations and actions that can be performed on the data. Transformations are operations that takes DataFrame/DataFrames and produces another DataFrame. Actions are operations that take DataFrame and returns results away from DataFrames such as a file output or results printed on standard out. It is only when we do an action that all the transformations preceding that get evaluated. Action spawns jobs, jobs spawn stages, stages spawns tasks. These are all displayed under separate tabs in Spark UI. There is also a separate tab for SQL that shows the exact queries and joins executed.
At the start, we talked about the 5 most common reasons for bad performance in Spark. They are the 5 S’s.
- Skew
- Spill
- Shuffle
- Serialization
- Storage
Before we go into any of these topics we talk about benchmarking. You have configured a brand new cluster and you have a dataset. You need to know if the setup will need some tuning to work with your data. If we use a query that has varying performance based on factors other than the data and the cluster setup or if it is query a that Spark has a shortcut for, our benchmark won’t be reliable. So what is a good query to use for benchmarking? Let’s consider these options.
count()foreach()that runs an empty lambda- A no-op write i.e.
df.write.format("noop").mode("overwrite").save()(it simulates a write)
count() is good for some file formats. But file formats such as Parquet or Orc that has metadata for rows included in the file, Spark can return a count without going through all the rows in the memory. So when the driver asks all the cores to return their local count they simply return the number from the metadata section. Therefore the execution time is not reflective of a query that will have to go through every single row. So count() is not a good method for benchmarking.
foreach() is bound to go through every single row. But foreach() performance can vary wildly between Scala and Python. Even if it is the simplest of lambdas that does nothing, foreach(lambda x: None) can take take a long time. Because it is written in Python, Spark’s catalyst optimizer cannot optimize it. Execution time can go up to 15 times of the equivalent code in Scala. It is a major red flag against using UDF (user defined function) in Python. I will elaborate more on this when I come to the 4th S (serialization). For now, we can conclude that foreach() is not a good benchmark.
A no-op write is free of all these problems. Therefore no-op write is a good benchmarking query. Next time, you go on a new cluster and you get your data you know what to use for benchmarking Spark performance.
Skew
By far the most common villain behind slow performing Spark jobs. Because Spark execution is organized by a driver into multiple cores and those cores are each assigned to a partition of the input data i.e. each core works on the data from one single partition, it is necessary that those partitions are roughly even for a balanced load across the cores. When Spark initially loads the data, unless the number of partitions is set by using spark.conf.set("spark.sql.shuffle.partitions", n) to a desired number n, Spark loads the data into 200 partitions across the cluster. For subsequent operations, the data can get repartitioned based on the query. Not all operations require repartitioning. Every time a shuffle occurs data gets written into file (shuffle write) in the executor cores and then reread (shuffle read) for further operations. The operations that require such movement of data (because data is getting redistributed across the cores) are called wide operations. join(), distinct(), groupBy(), orderBy() and collect() are examples of such operations. If they are avoidable, then it is best to do so. But often there are processes that do need these operations. In those scenarios, there are a few ways to remove the skew in data - some more efficient that the others.
Mitigations for skew
Adaptive query execution (AQE)
AQE is a new feature that came in Spark 3. In Spark 3.0 it was disabled by default. But as it proved useful and efficient, from Spark 3.2 it is enabled by default. By far the simplest way of solving skew and most often more efficient than the other options. If you are using a recent version of Spark, no need to look at the other two options really. AQE works as a query optimizer alongside Spark’s catalyst optimizer. AQE looks for partitions that are either 5x larger than the median partition size or larger than the predefined spark.sql.files.maxPartitionBytes (128 MB by default) and AQE breaks them into many smaller partitions. There is a small performance overhead for AQE as it is an additional step in the underlying process but the gain in performance outweighs the cost manyfold. It can be enabled by doing spark.conf.set("spark.sql.adaptive.skewedJoin.enabled", true)
Skew hint
This is the second preferred option due to ease of use. Performance is not as good as AQE and it is specific to Databricks Spark. So not even available to the vast majority of Spark users which is a shame. It is as simple as calling an extra function at the point of loading a DataFrame.
spark.read.format("delta").load("path/to/file").hint("skew", "field_name_to_join_on")
Salt
This is the most involved approach to implement and performance often falls behind AQE. It requires creating a salt field that adds variation to the field that has large skew.
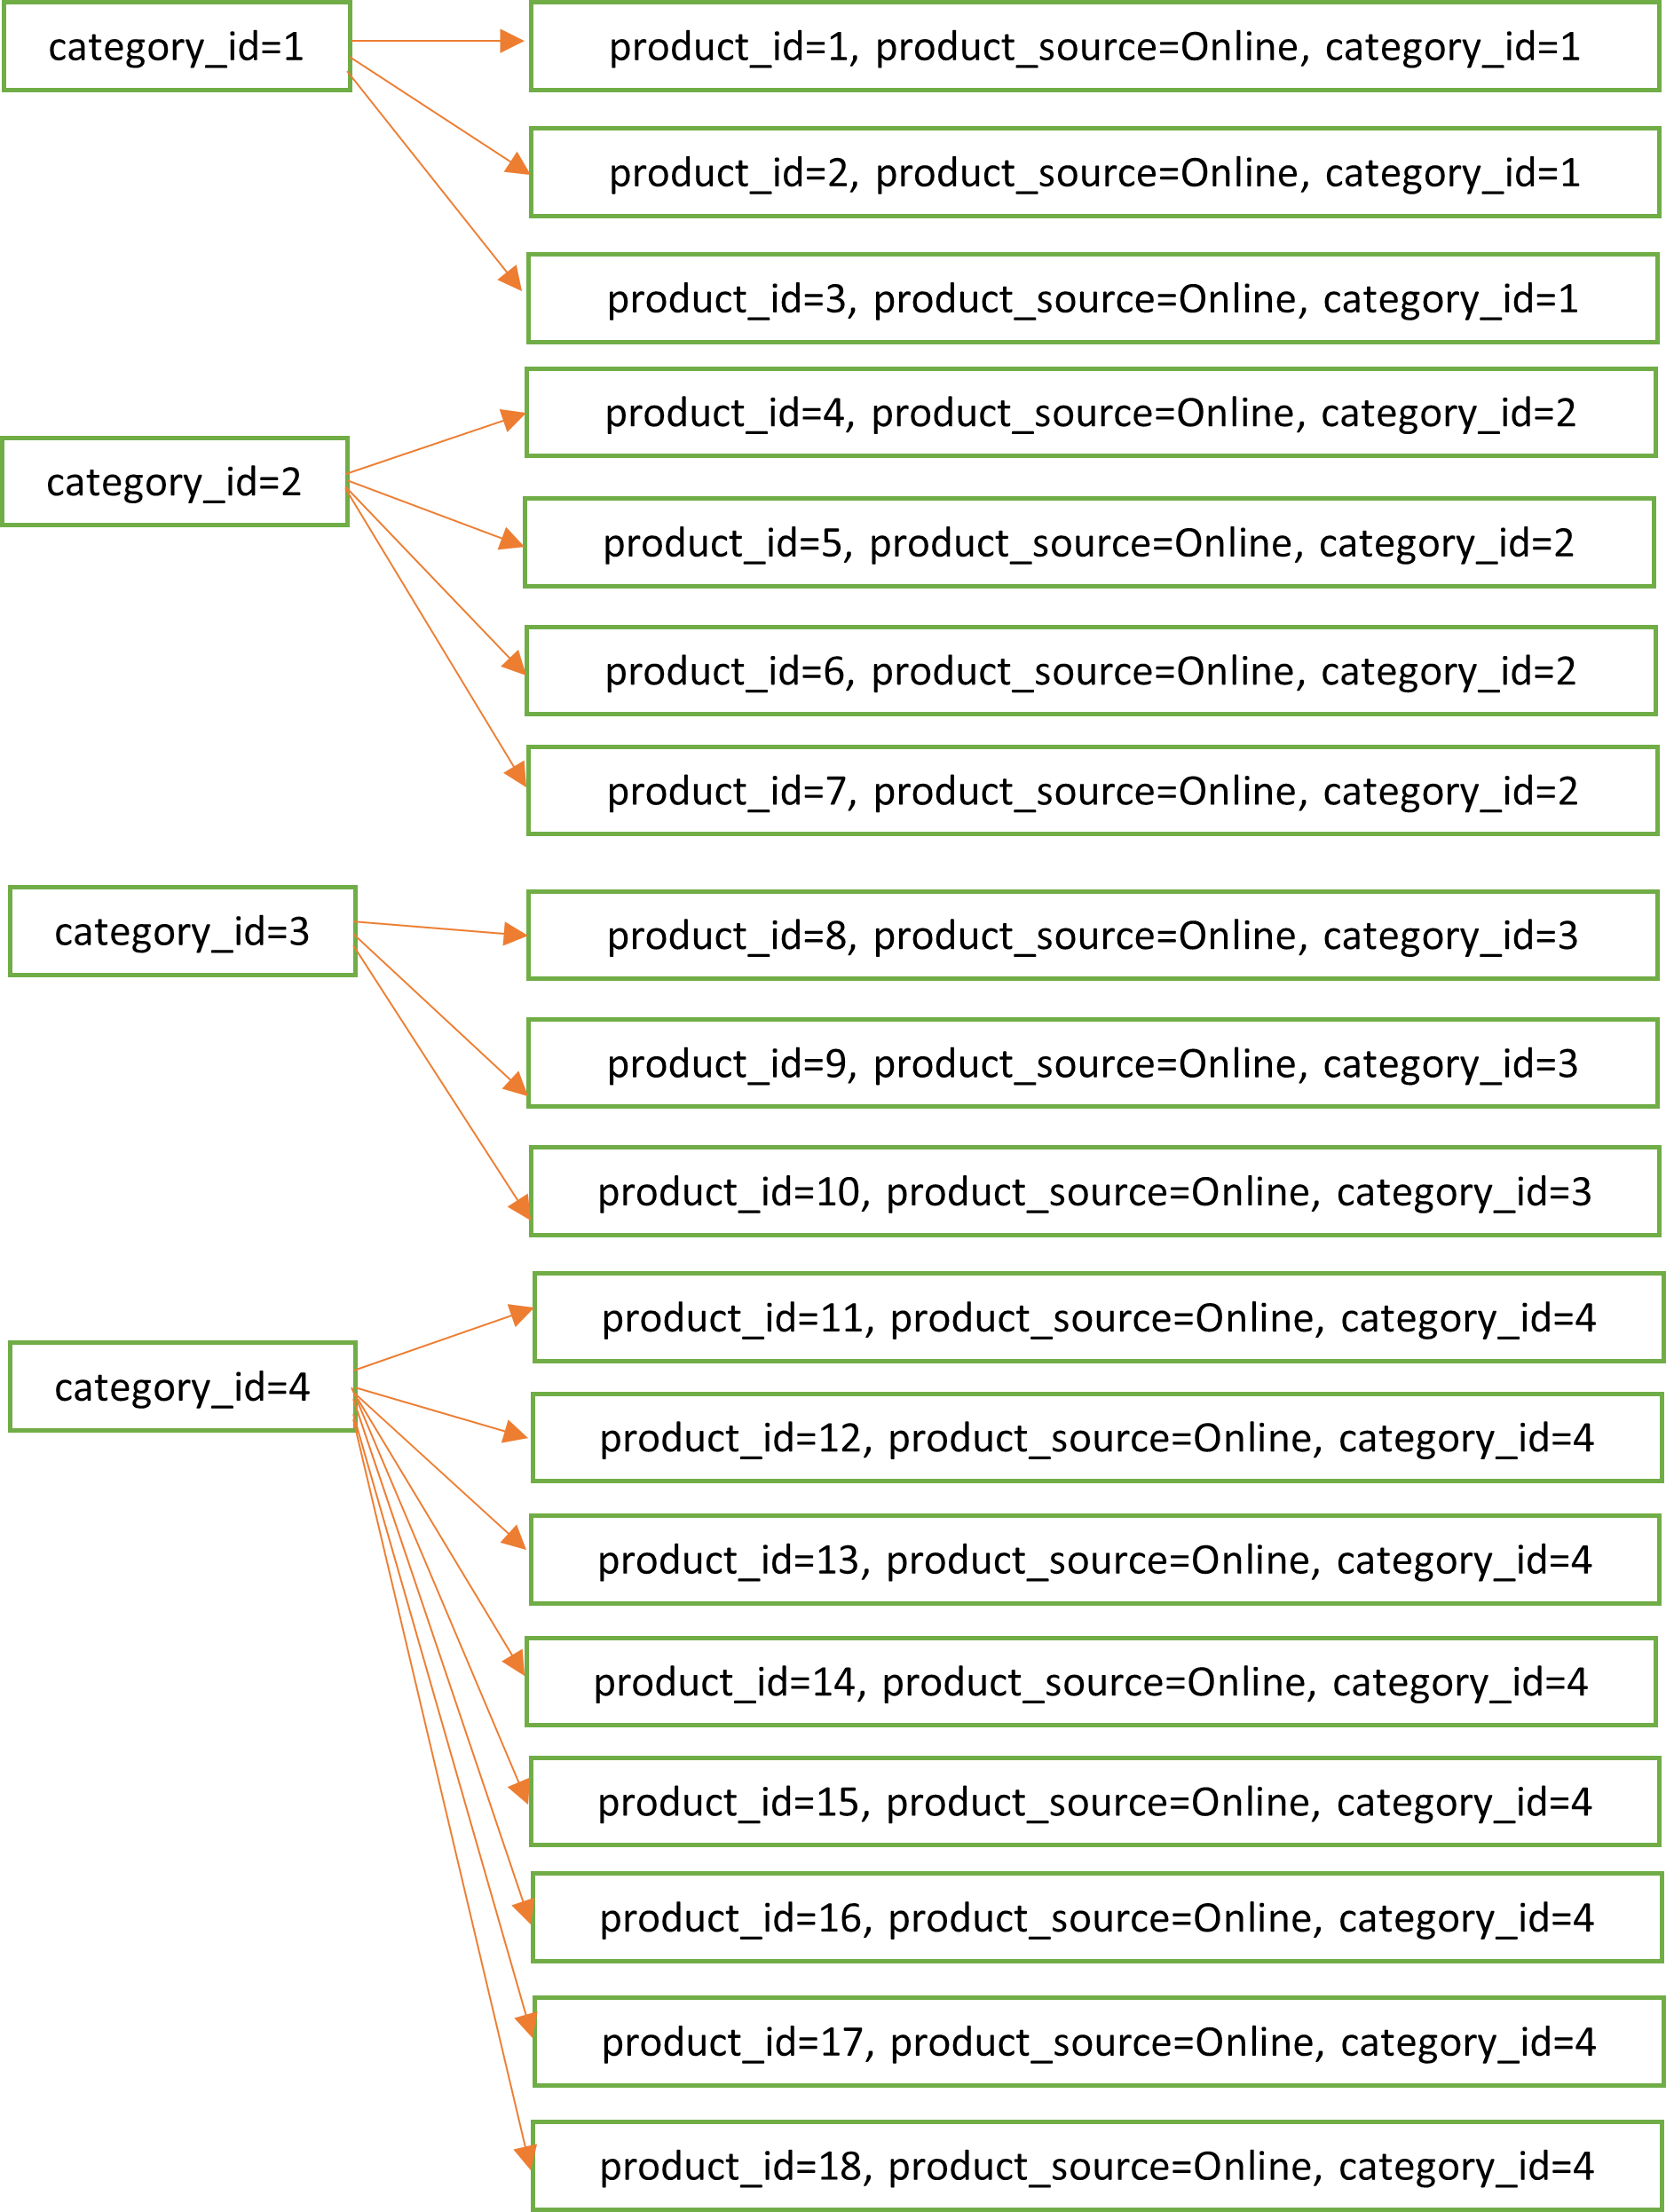
Let’s assume that the field we are joining on is called category_id, and there are four possible values for it. The distribution of rows for the categories looks as below.

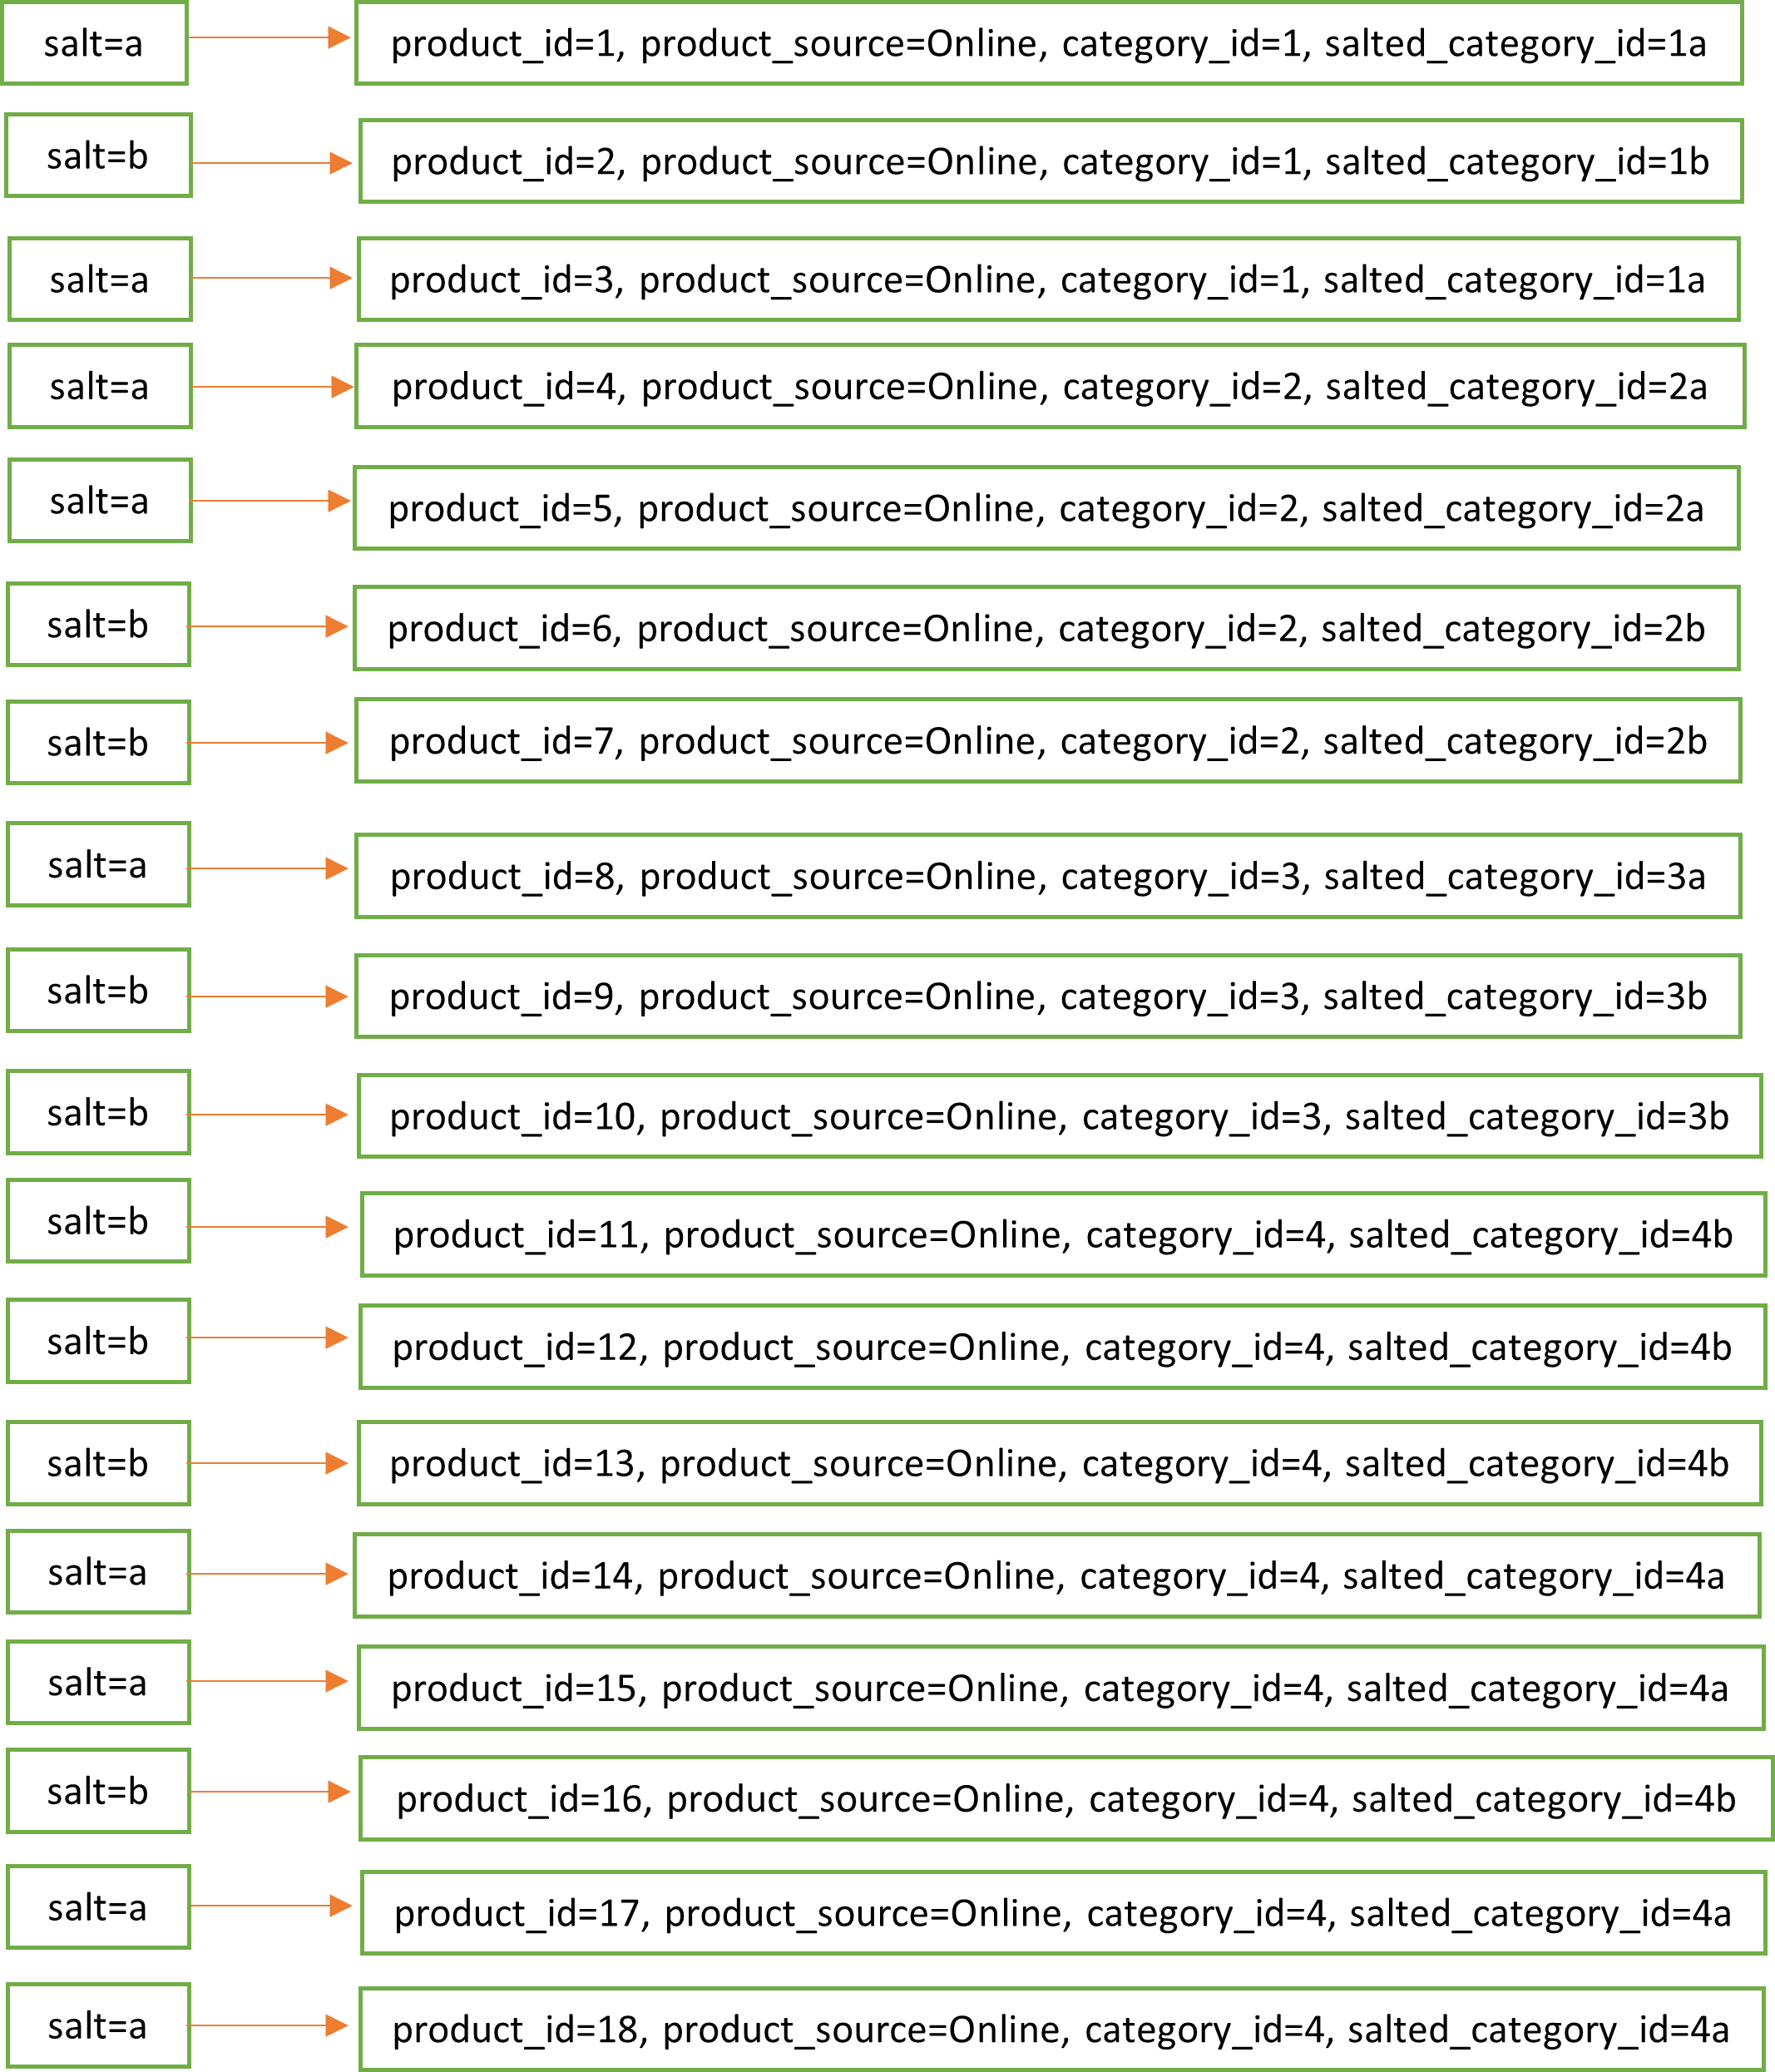
That shows the skew. To solve this, we add a new field called salted_category_id that can have two possible values category_id + “a” or category_id + “b”. And we assign those to the rows randomly. The distribution of rows now look like this.

Now if we do a join on salted_category_id, the partitions are more reasonably sized. There is no one particular partition that is in the risk of running out of memory.
Spill
Where does Spark does its execution? In memory. This was the first reason why Spark is so much more performant than Hadoop map-reduce processing in spite of both using the same execution method. But it is a common misconception that Spark does all the processing in memory. When an RDD is too large to fit in memory it gets written to disk. It then gets read in again into memory later. This is called spill and introduces significant increase in execution time. Spill is usually a side effect of something else such as Skew or Shuffle. So an occasional spill might not be a problem in itself. But it is worth looking out for it because it indicates that there is a deeper issue in the process or the data. It is usually solved by adding more memory or by finetuning the number of partitions. repartition() is sometimes used to bring data back into more balanced partitions.
Shuffle
I discussed shuffle a bit while explaining Skew. Shuffle is part of usual Spark processing but helps to minimize the frequency of it.
Mitigations
- Reduce the number of columns. Only select what you intend to use later. Also, filter out rows where possible. This in turn reduces network I/O.
- Denormalize the dataset so that fewer joins are required.
- Broadcast tables that are smaller than 10MB. Spark by default does a Sort-Merge Join. But you can override this by broadcasting one of the tables
df1.join(broadcast(df2),df1.id == df2.id). This means the smaller table is now available in all the executors and no longer needs to move data from the large table. - Pre-shuffle the data using a bucketed dataset. If you already know that the data is bigger than the recommended the 1GB partition size, it makes sense to split it into multiple files. Take care not to introduce Skew as you split.
Serialization
It came up in the discussion around foreach. Because Spark is written in java and everything is executed as Java bytecode, all Python code has to be serialized. The built-in functions in Spark are optimized for this but any user defined function is a huge performance bottleneck. Since Spark 2.3 though, there is pandas udf which is based on Apache Arrow and does low impact serialization. It is recommended to use pandas udf over the traditional python udf. The details of usage are available here.
Storage
The recommended partition size in Spark is between 128MB and 1GB. Anything too big will result time consuming shuffles and prone to spills. Large number of small files will introduce additional data movements and the process will become slow. There are options to auto-optimize with certain file formats. But generally repartition() can help.
Finally
I think the course was useful. It had some clear directions on where to look for problems, tools and mitigations. It is a bit inconvenient that some of the useful features such as auto-optimization for file size is specific to delta format, and some features are specific to Databricks but it is expected as they are trying to make a business case for their platform. Having been on a few data projects, it is quite clear that Apache Spark is going to be relevant for a good while longer.


