Introduction
This series of blog posts discusses the methods of estimating carbon emissions of end-user devices. Specifically, this looks at web user interfaces, such as websites and web applications, and the devices we use to access them.
In the first part of the series, I take a look at the Sustainable Web Design (SWD) method, the pros and cons of using it and what to be aware of when using it. In this second part, I examine the other end of the spectrum of measuring devices and compare a few profiling methods, including a couple of freely available software tools and a physical energy meter.
Power Profiling
Ultimately, the best way to measure energy use is to physically measure the device with equipment, such as an energy meter fitted between the device’s power supply and the socket in the wall. But that’s not a practical solution for large-scale testing, and the measurements will only consider the entire device’s energy use, providing no insight into the energy use of the specific tasks and processes running.
Alternatively, we can measure the device’s processors by implementing the Running Average Power Limit (RAPL). Depending on the processor type and operating system, there are different tools for taking RAPL readings. On a Mac (Apple Silicon M1), for example, the Powermetrics Command Line Interface (CLI) outputs profile samples, including the CPU, GPU and ANE energy use, detailed running tasks, network activity, and disk activity. This enables us to take a bottom-up approach to measuring device energy use with more granularity and focus on what the device is doing.
Matt Griffin goes into more detail about these approaches in his post - Accurately measuring the energy consumption of hardware. In this post, I take a specific look at using Firefox Profiler, Powermetrics and an energy meter, and compare the observations made from them.
Mozilla Firefox Profiler
Mozilla Firefox Profiler is a tool that captures the performance of the Firefox browser and profiles the web pages visited, specifically with the option to profile power use. It also includes a carbon emissions estimate implemented by Fershad Irani (of the Green Web Foundation). This carbon emission is based on the global average of 442gCO2e/kWh, but it is possible to apply your own carbon intensity value. Fershad’s article explains in more detail the power profiling and how to use it.
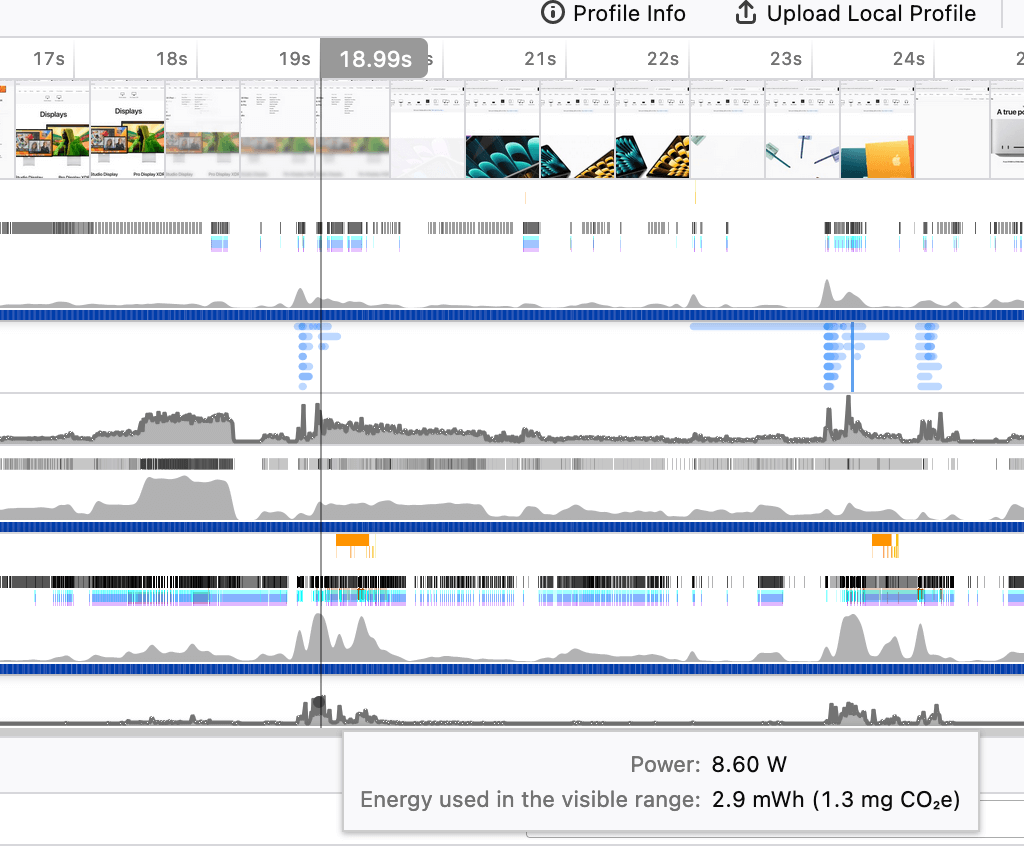
As an example, I visited the Apple UK website and navigated to a new page. Firefox Profiler presents the captured detail, as shown in the screenshot below.

As you can see, at any given point you can inspect the power use, energy use over a period of time and the estimated carbon emissions.
Powermetrics
Powermetrics is a Mac-only command-line utility tool for gathering CPU, GPU, network and disk activity and much more. For more information see the Firefox quick start guide. It is especially useful for monitoring activity over time and collating and comparing energy use with tasks and activities. Powermetrics captures snapshots of the system at intervals (of 5 seconds by default), each snapshot containing a lot of detailed information at the time of each snapshot. Powermetrics can be configured to sample specific metrics of interest, and the intervals reduced for finer granularity.
Energy Meter
I’m using a Meross Smart Plug with Energy Monitor to capture the energy use of devices. I chose this device as it logs the energy use over time. I can conveniently access this from a smartphone and analyse power use by day, per hour as well as in real time.
Testing Profiling Methods
By profiling the energy consumption of a device with a meter we can measure the energy use whilst using a website or application. Then, applying the known carbon intensity of the device’s regional energy carbon intensity, we can estimate the carbon emissions with some accuracy. This article focuses specifically on the power and energy consumption, and does not go into the detail of calculating the carbon emissions.
There are various profiling applications and developer tools for measuring performance, energy and battery use for smartphones and tablets too. For this article, we’ll be focusing solely on a laptop device.
Note that the following profile and monitoring was captured on an Apple 16-inch MacBook Pro 2021 with an Apple M1 Pro chip. This may vary for other devices and processors. Like the first part of this series I’ll be taking a look at the Scott Logic blog.
Firefox Profiler
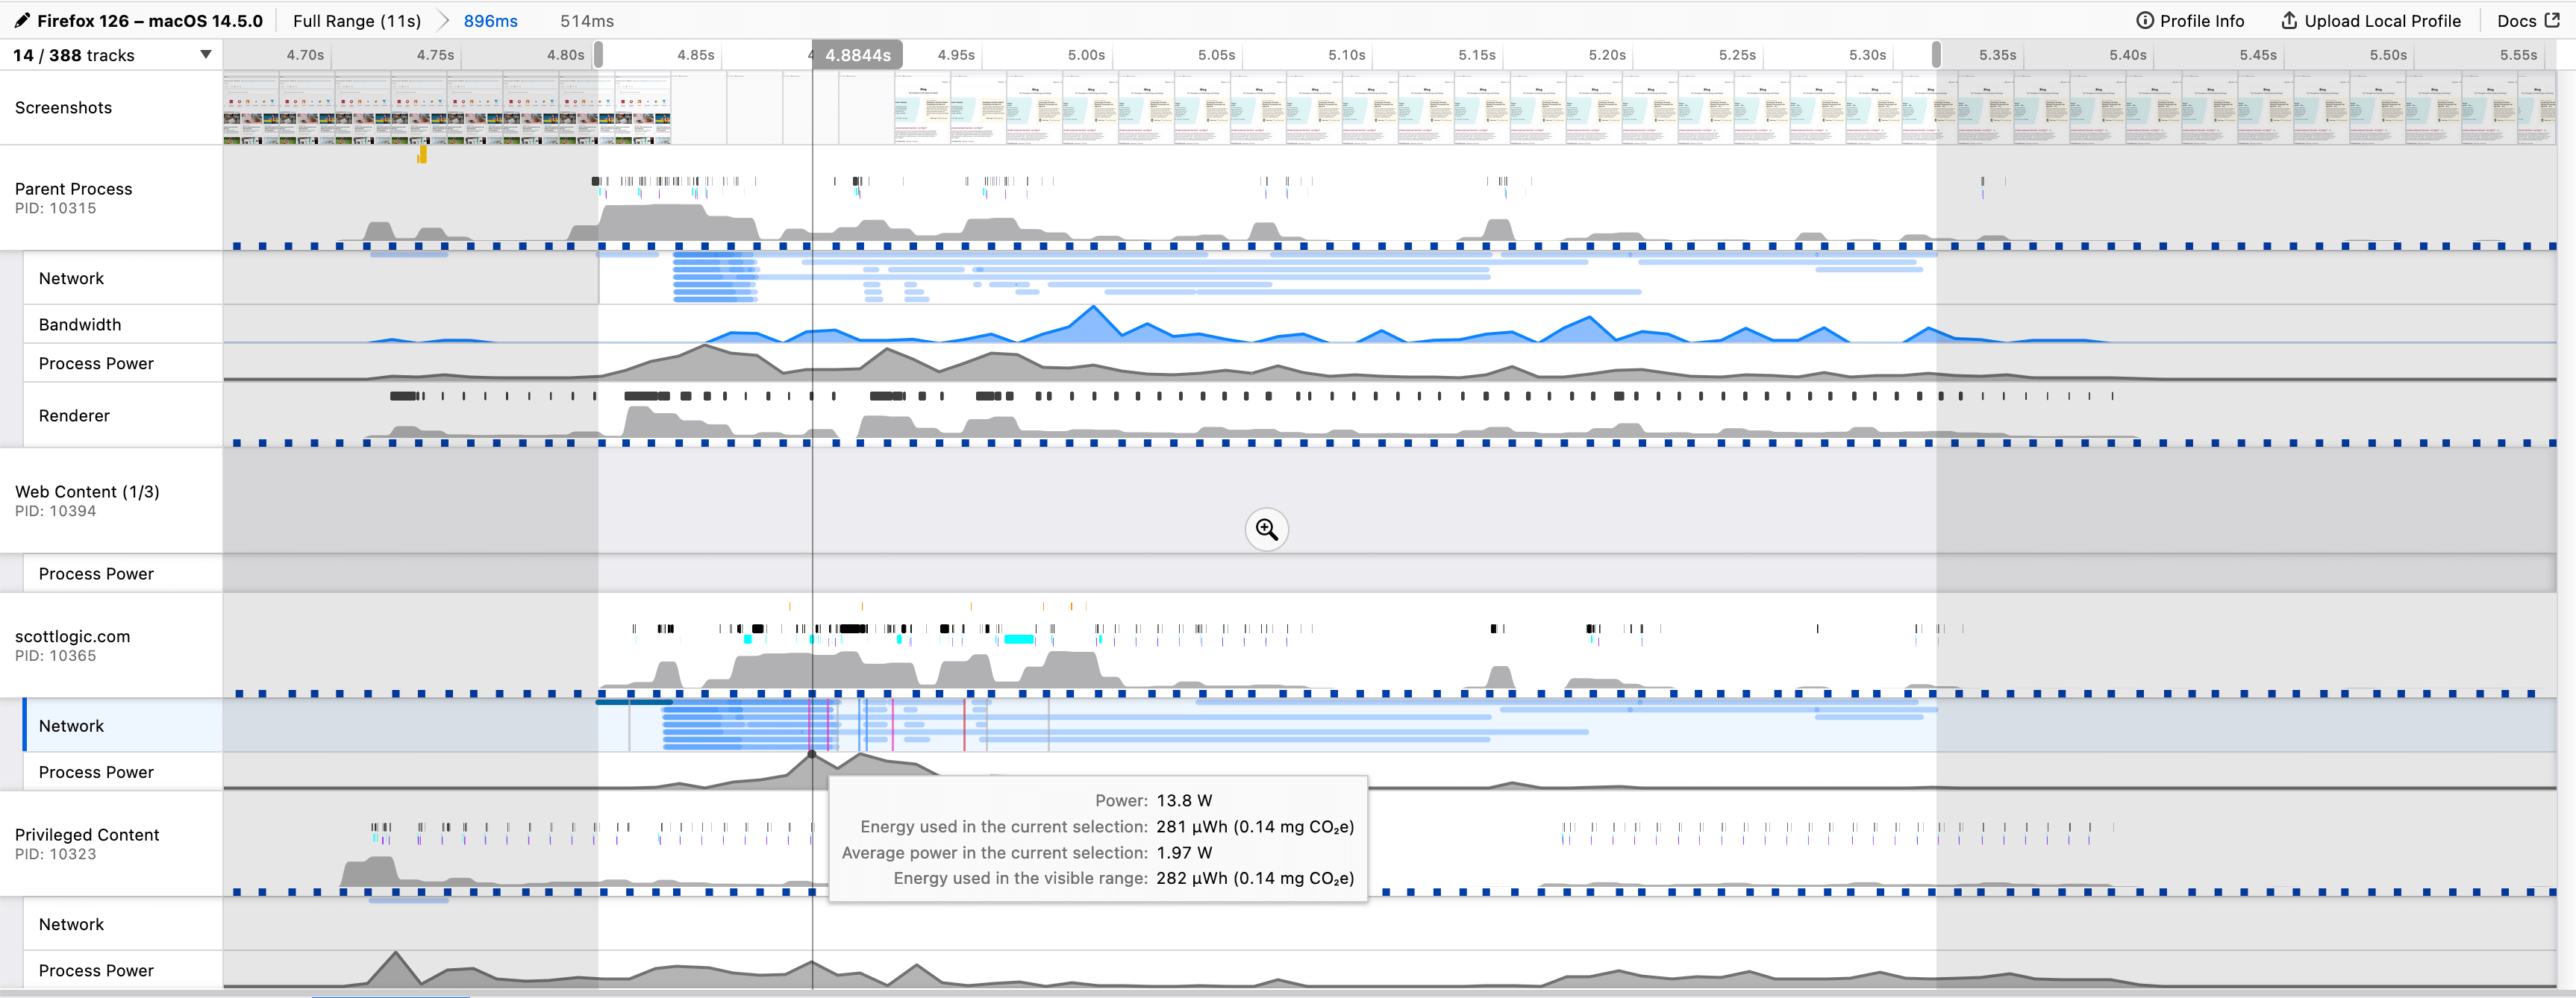
With the Firefox Profiler running, I navigate to blog.scottlogic.com (from the Firefox homepage), wait a few seconds then complete the capture of the profile. Below is a screen shot of this capture with the highlighted range starting at the beginning of the first network request and ending at the end of the last network request. The screenshot shows the tooltip containing process power information, positioned at the peak of the power draw.

A few points of note from this capture: - the highlighted selection (from first to last network request) took 514ms. - each snapshot is taken at 10 millisecond intervals - a peak power of 13.8W was measured at the point where multiple network requests/responses were completing - the average power in the selection is 1.97W - the highlighted 514ms selection used 281μWh - I’m ignoring the 0.14mgCO2e for now as this is based on global carbon intensity, and the focus here is to obtain power and energy consumption.
Note that to calculate the energy used (281μWh), it takes the average power, dividing it by the number of seconds in an hour (3600) and multiplying it by the number of seconds (0.514):
\[1.97\ W ÷ 3600\ s/h \times 0.514\ s = 281\ μWh\]Powermetrics
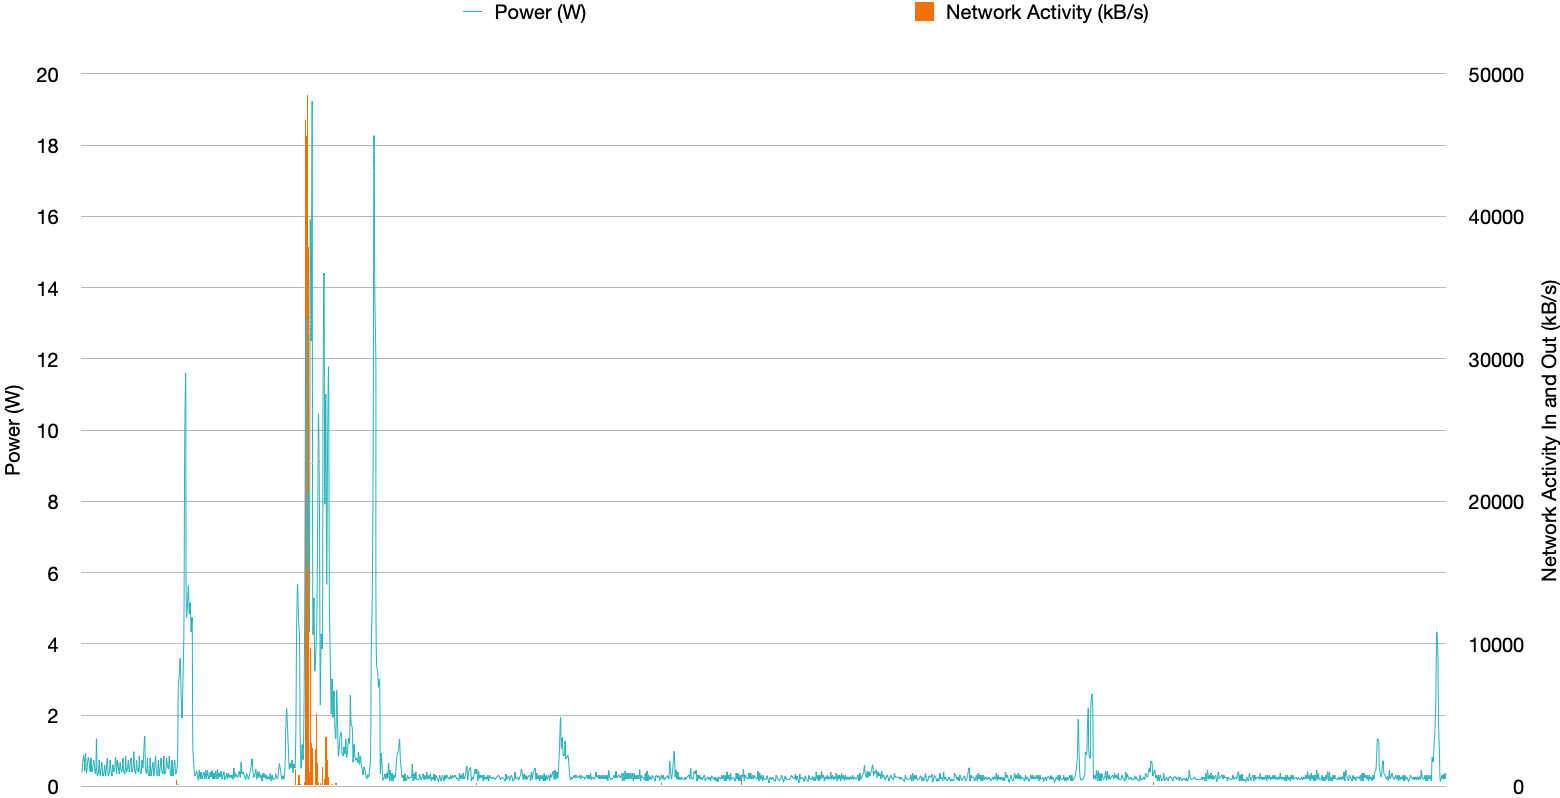
The same test (loading the blog page) was profiled using the Mac command line utility Powermetrics. 1500 samples were captured at 10ms intervals - a 15 second profile (powermetrics --samplers network,cpu_power -n 1500 -i 10). The results of this are compiled into a spreadsheet and displayed below graphically:

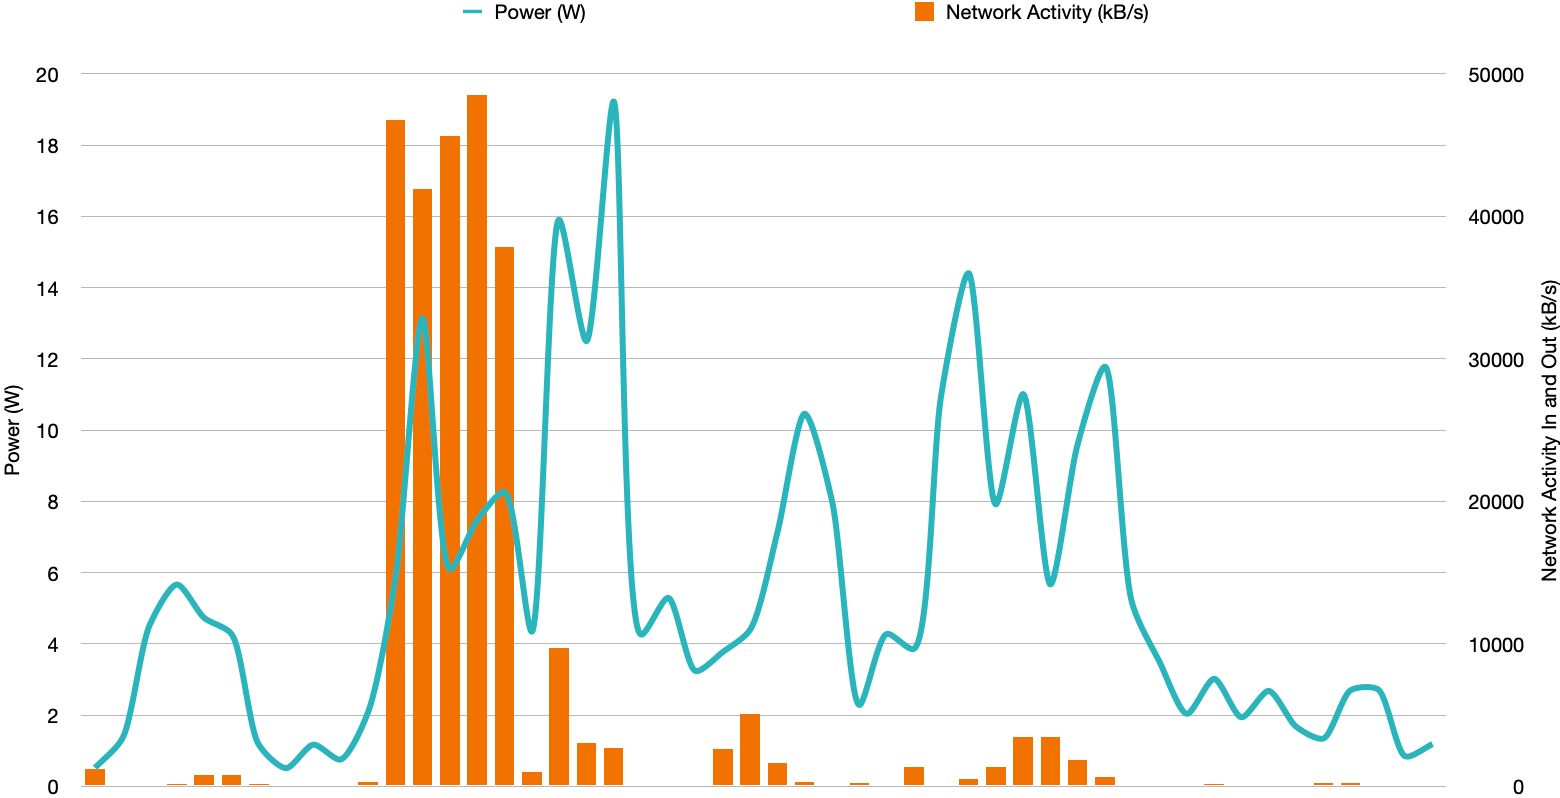
Focusing on the area of activity where the page loading occurred, I’ve narrowed the time range to 500ms (similar to the 514ms of activity recorded on Firefox Profiler):

Some points of interest: - it is clear to see how the power increases with network activity (though not proportionally), and the power delay after the networking activity is perhaps the processor handling the data received and rendering the page - a peak power of 19.2W was measured, approximately 40ms after the peak of networking activity - the average power in this range is 5.53 W
Using the same method above used by Firefox Profiler, we can calculate the energy use in this 500ms time frame:
\[5.53\ W ÷ 3600\ s/h \times 0.5\ s = 768\ μWh\]The Firefox Profiler suggests that 36.6% of the total system’s processing power at that time was used to load the web page. Note that Firefox profiler also provides separate values for the parent process (the Firefox application itself, which would contribute to the system processing). The parent process and privileged content power can be seen in the Profiler screenshot.
Although there were no other active applications running it’s possible that background processes (and Powermetrics itself) may have contributed to the processor activity. There is some evidence in the network activity that there was some background activity going on beyond the page load spike during the test.
Energy Meter
However, these profiles still do not consider the energy of the entire device, such as the power used by screen. To monitor this, the power meter is physically connected between the MacBook’s power supply and the wall socket. The following observations were made:
- Idle after restart (no external monitor connected), measured at ~8W (Apple quotes 7.09W).
- Idle with only Firefox application running: ~8.5W
- Idle with a few applications running (Firefox, MS Teams, Notion): ~9.5W
- Idle with few applications running and a connected external monitor (HP Z24s, not including the monitor’s energy consumption): ~12.5W
- Hourly average use during the working day (8 hours): ~17Wh
- Daily average total consumption on a working day (working ~8 hours, sleeping 16 hours): 178Wh

Accurately capturing the energy use on the meter whilst loading a web page is not easily achievable due to the limited granularity of the meter (to the hour), and the live monitoring of the energy meter use is approximately accurate to 0.5Wh. But it was observed, in real-time monitoring, a ~0.5W rise in power as the web page loaded. But without more sensitive and accurate energy monitoring it is difficult to precisely measure the device’s total energy use whilst loading a web page.
Summary
When loading the Scott Logic blog page, the following profiles were measured whilst loading the uncached page (4.3MB):
- Firefox Profiler (514ms profile): recorded 0.000281Wh of energy use.
- Powermetrics (500ms profile): recorded 0.000768Wh of energy use.
- The energy meter indicated an approximate rise of ~0.5W of power; but there is insufficient accuracy to determine the energy consumption when loading the webpage.
Taking into account the 768μWh (0.000768Wh) energy used (by the system processors) to load the webpage - it’s rather trivial (less than 0.01%) compared to the 8.5Wh of energy use for laptop consumes with Firefox open and idle or no applications running at all and the system idling at 8Wh.
Now, this starts to highlight some key points and raises further questions.
Firstly, the Firefox and Powermetric profiles measure a single page load, a 500ms window within a one hour period. That’s an important note. It does not take into consideration the time the user spends on the webpage; it’s a metric purely to measure the page load, and as we can see, that’s a relatively insignificant value compared to the device’s energy use.
Let’s assume a user spends 5 minutes reading each blog post, and they do this for 1 hour. That’s 12 page loads (navigating directly from post to post):
\[12 \times 768\ μWh = 0.0092\ Wh\]0.0092Wh is still a rather insignificant value compared to 8.5Wh for the system with only running the Firefox browser. This implies that the device’s energy consumption is of more concern than the page load, and analysing metrics shouldn’t be limited to just the power consumed by processors.
Another way to look at this is the average power draw for 5 minutes :
\[8.5\ W ÷ 60\ min/h \times 5\ min = 0.708\ Wh\]In the previous blog post in this series, using the SWD method (end-user device boundary) we calculated that each visit to the blog page on the user device equated to 1.352Wh. Based on my laptop’s idle 8.5Wh energy use, that’s just under 10 mins of use, or using the hourly average of 17Wh just under 5 mins of use. It sheds some interesting perspective that the SWD method aligns to these findings.
Of course, this isn’t a scientific experiment, or tested many times, across many devices. It’s a demonstration of a simple static web page, but what I hope to show is that, whilst we have tools that can accurately measure processing power, this bottom-up approach doesn’t capture the realities of users using a device, and the actual energy consumption, which (whilst has low granularity) the energy meter can show us.
Detailed bottom-up profiling may have some value when trying to optimise applications, especially high performance and processor intensive applications. But it does not provide the bigger picture of what the device consumes, in this case the user’s device and how they use it is what has the greatest impact, not how quickly or efficiently your static web page can load.

